
One of the most important tools used by the Joomla Bamboo team to troubleshoot websites and build templates is the Chrome browser. Inside the Chrome browser are a series of bundled web authoring and debugging tools, which are grouped under the name Chrome Developer Tools or DevTools for short.
In this brief tutorial we are looking at a particular feature of the DevTools tool set, which is the “Computed Panel”.
Open a web page in the Chrome browser and using one of the following methods open the DevTools panel:-
1. Click the Chrome menu button, which is found in the top-right corner of the browser window, select Tools and then Developer Tools.
![]()
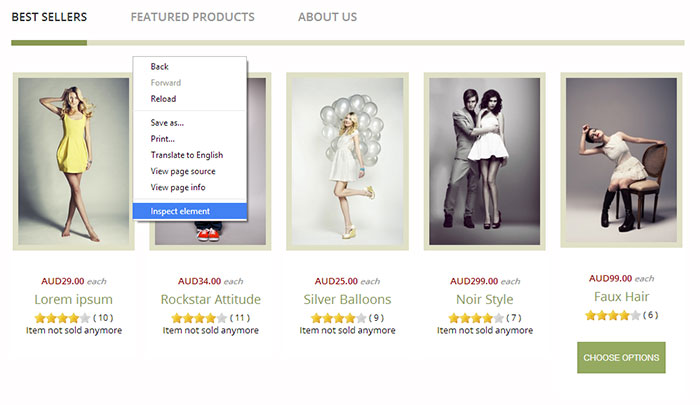
2. Right click on a web page element and from the resulting pop-up box choose “Inspect Element”.
3. Press F12 if on a PC.
The DevTools will now open at the bottom of the screen and a series of tabs will be shown with the Elements tab active. The Elements tab window is split into two panels with HTML on the left and CSS styling and Javascript debugging on the right.
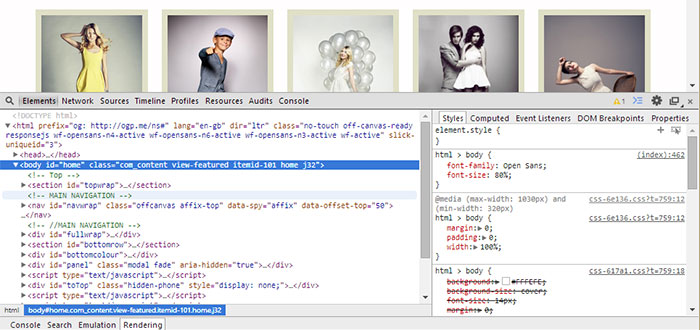
The CSS that applies to an element is listed under styles in the right panel and includes all the styling from the different style sheets that apply. (The styling that is overridden or invalid is indicated by a strike through).
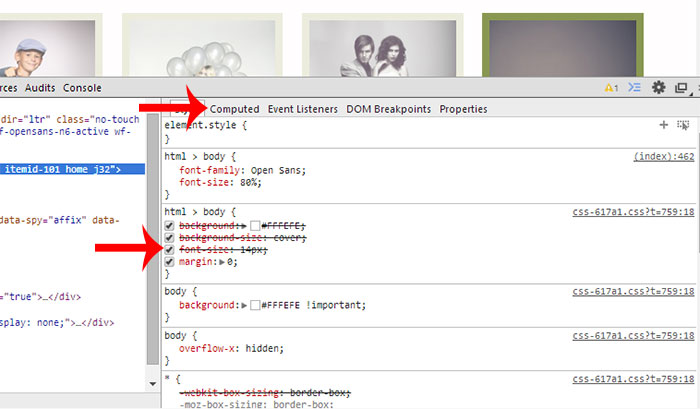
Click the “Computed Tab”, which is situated on the right of the styles tab. This tab only lists the style rules that are rendered on screen and ignores any other styling rules.
When the arrow to the left of the style is clicked, it will display the style sheet file name (as a link) and line number for that style.
![]()
The filename when clicked will replace the HTML content in the left window and display the CSS file and the line of code. This is much more efficient than scrolling through the styling list in the elements tab.
The CSS in the computed tab can't be edited but it can be changed in the elements tab or in the window that opens via the style sheet filename link.
This tutorial only looks at one feature of the Chrome DevTools, but there are many more features available. If you are new to using the Chrome Developer Tools, we'd suggest looking at the different tabs, experimenting with the tools available and trying out the browser CSS testing capabilities.
If you have a request for a Joomla tutorial, please get in touch.